Lab 1 Rehearse 1 Quick Start
This course is not as hard as you think it is!
Lab 1 Rehearse 1 Quick-Start

Check the Resources page
We are often creating additional “How to” videos for this course. Get in the habit of checking our lab Resources page when you start a new module/lab and watch the additional video resources there.
Let’s create something using R!
In this course, we will be using the “statistical” programming language R as our tool to analyze data. And it will also help us to understand just what our analyses are doing. In each of the lab assignments, we will show you how to use R to answer specific questions and solve specific problems.
But remember this is not a programming or coding course!
Or a traditional statistics course for that matter.
We will provide you with the code “chunks” you need to get R to crunch the numbers, create data visualizations, and generate your report. You will learn to use the “copy/paste/edit” method for reusing code chunks that were previously written by someone else.
The goal of this course is to improve your data literacy, to help you become data savvy. It is not intended to make you into a statistician or data scientist. Rather it is to give you enough of a statistical foundation - concepts and tools - to enable you to be more effective in this “data-driven” world.
In this first Rehearse, we will do a Quick-Start exercise in which you run R code chunks to get some data, do some analyses on that data, create some visualizations, and write a report. We think if you see what you are going to be “making”, it is easier to make sense of the individual steps needed to get there.
This is the data visualization you will make in this lab with a couple of clicks:
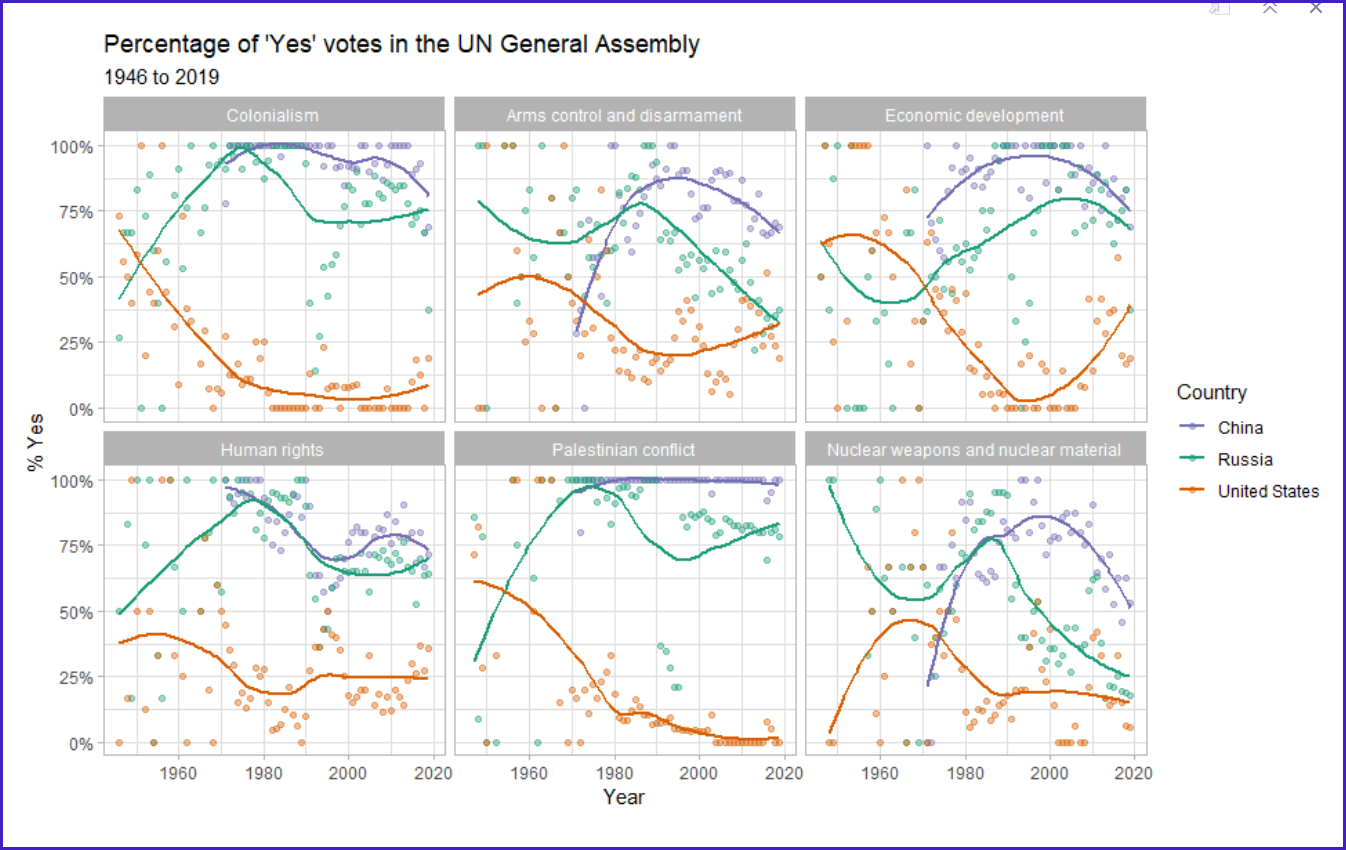
Technically, this is a visualization of a multivariate analysis of UN votes by three countries over time. There are four variables: time, vote, country, topic.
But enough of the details. We will talk more about variables and the analysis later, as well as the steps in the code which generates the visualization.
RStudio is now posit
Please note that the company that created and maintains RStudio Desktop and RStudio Cloud re-branded itself as “posit” in late 2022. And as part of that re-branding, RStudio Cloud became “posit Cloud”. However, posit decided to not change the name of RStudio Desktop. posit Cloud functions essentially the same as RStudio Cloud did and as the RStudio Desktop version still functions.
As shown in the following video, that will take you to the posit Cloud log-in page. There you can quickly create a free account, open the Quick-Start project with all you need, select the Quick-Start R markdown worksheet file, and click Knit to run the code chunks and create a webpage report with your graphics.
And you can also choose to create a reproducible Word or PDF report as well, but we will wait to do that until the Remix/Report part of the lab.
Note, that if you already have an RStudio/posit Cloud account, you can just click the link above and log in to it and the Lab 1 Quick-Start project will be there in your workspace.
Link to posit Cloud to Set Up Lab 1
Click Here Set Up Lab 1 workspace for the first time
 Important
If you have already set up Lab 1 Quick-Start, do not use the Set Up link again as it may reset your work. The set up link loads fresh copies of the required files and they could replace the files you have worked on.
Instead use this link to go to posit Cloud to continue to work on Lab 1:
Return to your previously set up Lab 1 posit Cloud workspace
Watch Video
Summary of Tasks in Quick-Start
- Click on the link to go to posit Cloud sign-in page.
- Create your free account or log-in to your existing account.
- Click on the Quick-Start project in your posit Cloud Workspace.
- Save the temporary copy of the Quick-Start project to your Workspace.
Important
Remember to save the “temp” workspace as “permanent.”
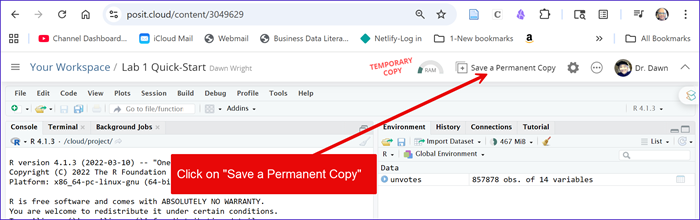
The image below shows what your posit Cloud
workspace should look like immediately after you create it. Note the red
message “Temporary Copy” near the top. This is telling you that you are
working on a temporary copy that will be deleted if you close the
workspace before saving it as a permanent copy. Any work you have done
in the workspace will be lost.
So, click on “Save a Permanent Copy” as your first
step.
- Select the Lab-1-Rehearse-1-Quick-Start.Rmd file by clicking on its name. This loads the document in the Source/Editor window.
- Note you may get a pop up message about installing needed packages. No worries - watch this short video Installing needed packages - How to
Type in your name in the author space at the top. Be sure to put it between the two quotation marks around “First Last”. Also replace the date with the date you work on the Quick-Start.
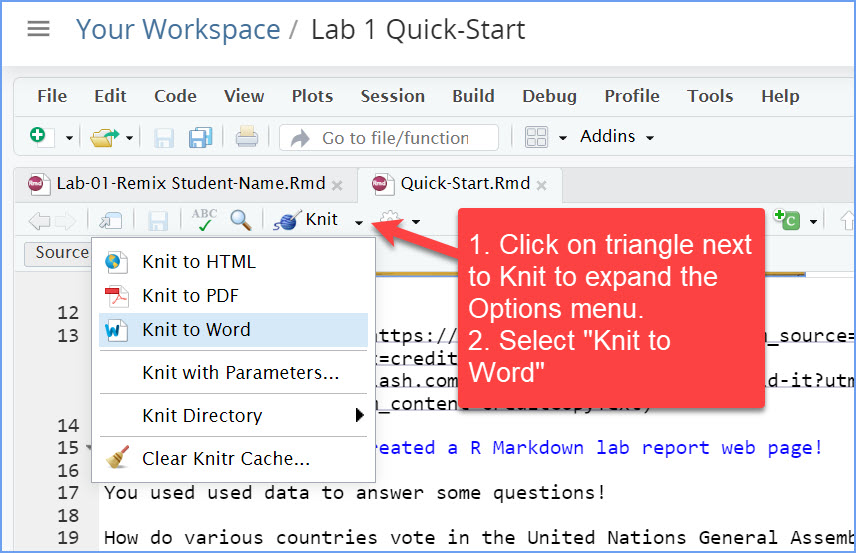
Knit the Lab-1-Rehearse-1-Quick-Start.Rmd file by clicking on the Knit icon. This will create the reproducible document which is set to default to a web page (HTML) that opens.
Note: you have the option of knitting to either a Word or a PDF document. This is not required for this Lab 1 Rehearse 1 Quick-Start.
If you knit to an HTML page, grab a screenshot of the top of the webpage showing your name as author and the current date. It should look something like the one below.
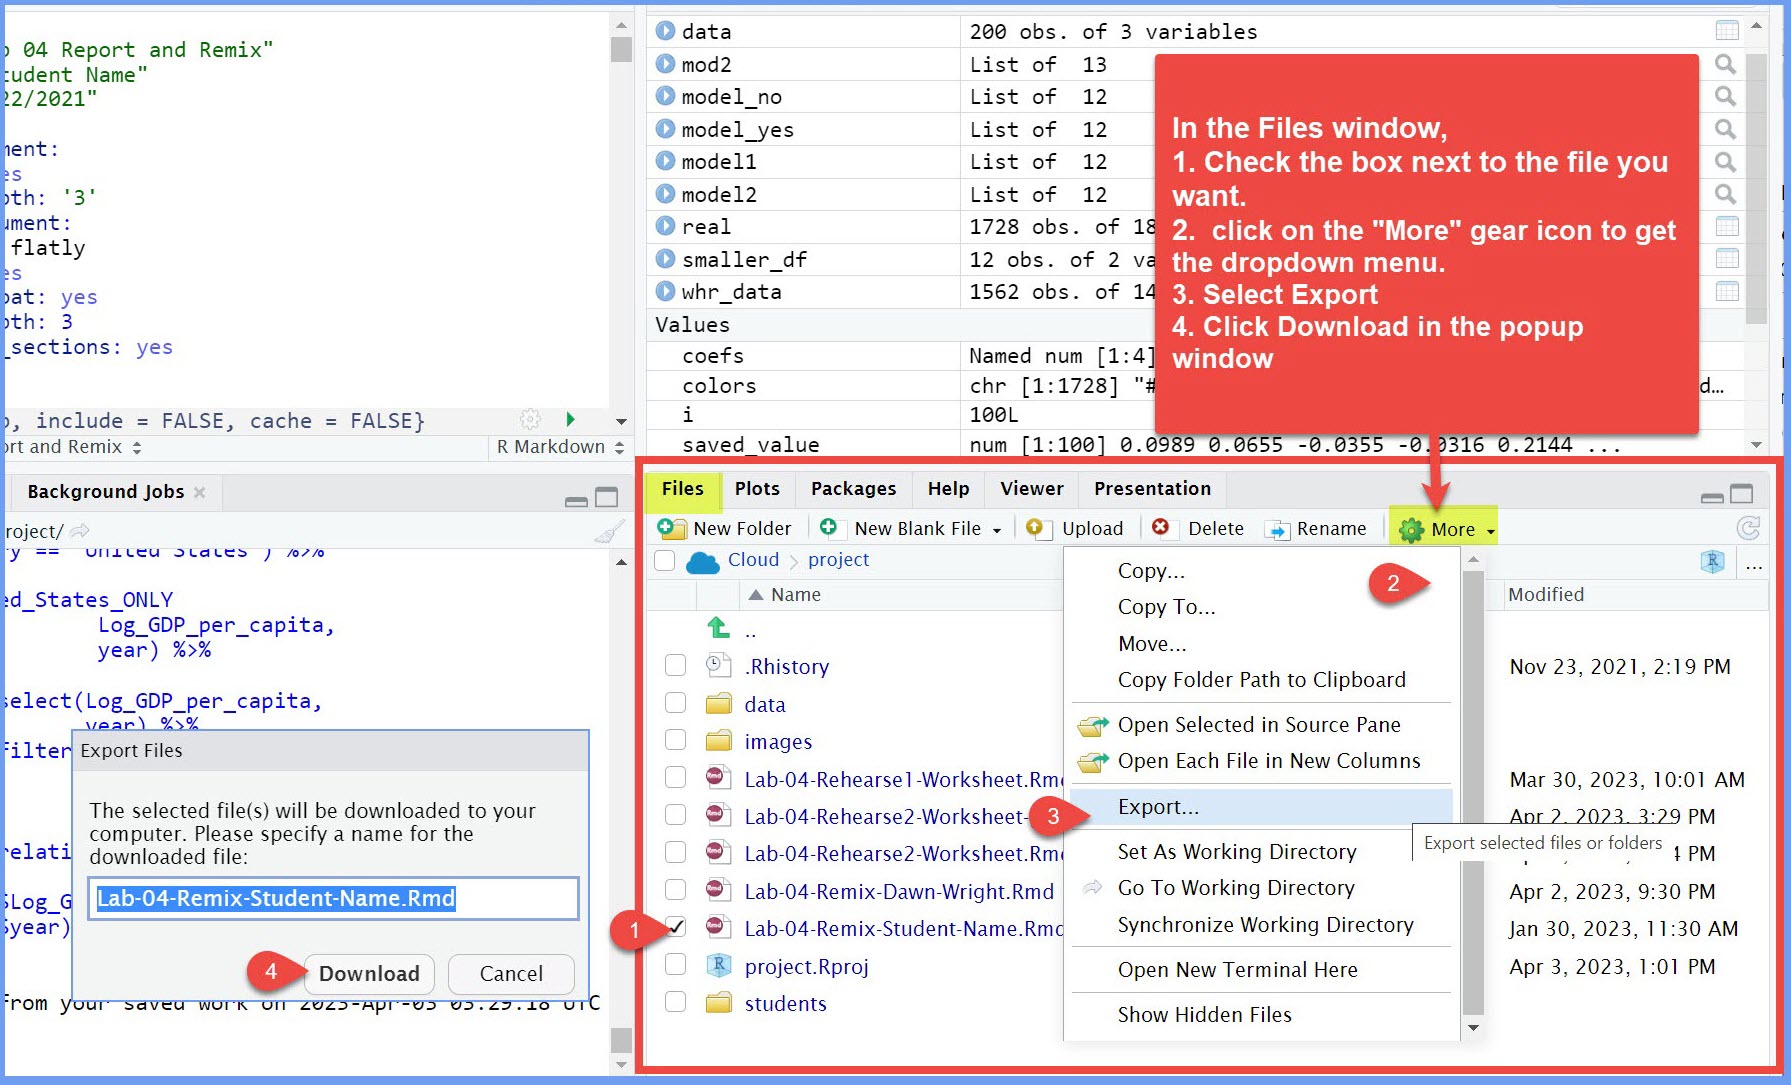
To export a document/file from posit Cloud, see this next image:
Submit the screenshot (or the Word or PDF document) in the M1.3 Lab 1 Rehearse: Quick-Start assignment area in Canvas. Or submit a screenshot of your Posit Cloud account if you hit a snag some where.
Note: do not submit the actual HTML page as those often do not open properly in Canvas.
Important!
Lab Assignment Submission
There are two due dates for the Lab 1 Rehearse assignment submission:
Thursday midnight Eastern Time - 1st submission
Remember you need to submit some evidence of your work on the Rehearse 1 Quick-Start in the M1.3 Lab Rehearse : Quick Start assignment area in Canvas. This initial submission is due by Thursday midnight Eastern Time to get max points.
But don’t worry if you cannot get the entire Quick Start completed by then. You will not lose very many points as long as you do submit something in that assignment by the end of the week. The Thursday initial deadline is to give you a little push to try to get started earlier in the week to avoid that Sunday afternoon crunch time.
For example, you can submit evidence of having set up your Posit Cloud workspace.
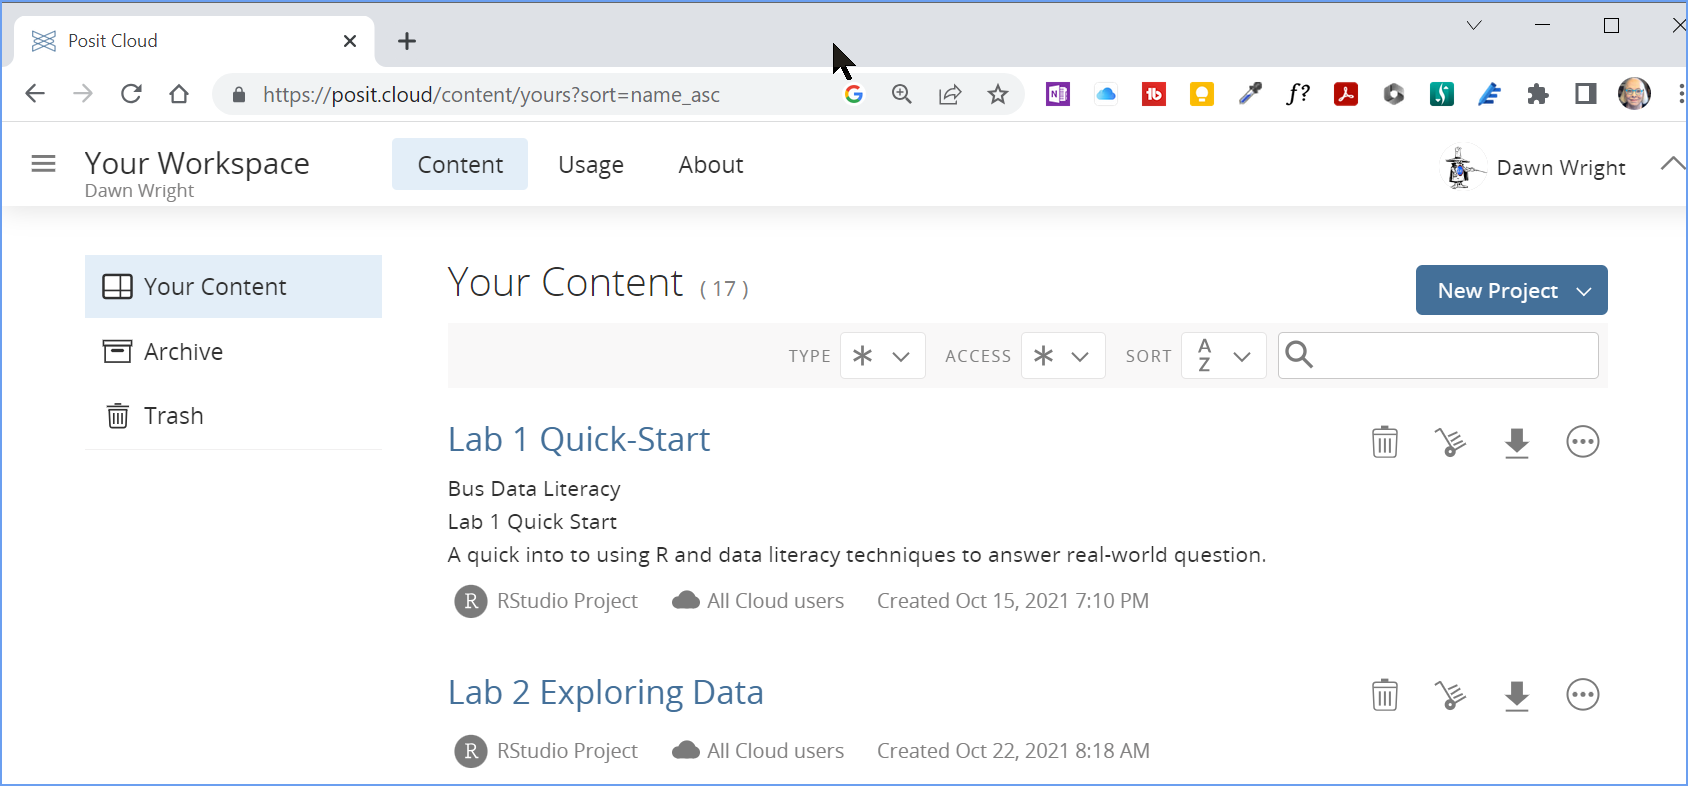
Here is an example of a Posit Cloud account “Your Workspace” screen shot image with the Lab 1 Quick-Start project visible. It is OK if you have other projects in Your Workspace, but you do need the Lab 1 Quick-Start project visible in the “Your Content” list.
If you have completed the Quick-Start exercise, you may submit that on Thursday too to get max points for this assignment. In this case, there is no need for a second submission.
Sunday Midnight Eastern Time - 2nd submission
If you were unable to complete the Quick-Start in time for the Thursday night submission. you can submit it by Sunday night. Make your submission in the M1.3 Lab Rehearse : Quick Start assignment area in Canvas.
Then, move on to the Rehearse 2 Quick-Start Debrief.
 Previous: Lab 1 Overview
Next: Lab 1 Rehearse 2 QuickStart
Debrief
Resources
David Robinson (2017). unvotes: United Nations General Assembly Voting Data. R package version 0.2.0.
Erik Voeten “Data and Analyses of Voting in the UN General Assembly” Routledge Handbook of International Organization, edited by Bob Reinalda (published May 27, 2013).
Much of the analysis has been modeled on the examples presented in the ” unvotes package vignette “.

This
work was created by Dawn Wright and is licensed under a
Creative
Commons Attribution-ShareAlike 4.0 International License.
Date 1/12/26
Last Compiled 2026-01-12