Lab 2: Exploring Data Overview
Business Data Literacy

Image by WikiImages from Pixabay
Lab 2: Exploring Data
In this lab, we will learn how to better understand data by conducting Exploratory Data Analysis (EDA). EDA involves the use of graphical and numerical techniques to uncover the structure of the data. We use EDA to help us see what is contained in the data, what the variables are and their observations – how they were measured or counted. We want to begin to understand if there are interesting patterns or relationships between variables, and if there are unusual observations.
To learn more about how to conduct an exploratory data analysis, we will have two tutorials in the Rehearse portion of this lab for you to work through.
Rehearse 1 Graphing Data, will be on visualizing data. Rehearse 2 Describing Data will be on the numerical exploration which we call “descriptive statistics.” Again, don’t be afraid of the “s” word. We provide all you need in the form of our friendly code chunks.
 Important
Before you begin the two rehearse sessions, make sure you have followed the link below to set up the Lab 02 project in your Posit Cloud account.
To get started in Lab 02, follow this link to set up Lab 02 Exploring Data in your RStudio/Posit Cloud workspace.
Link to Set Up Lab 02 Exploring Data

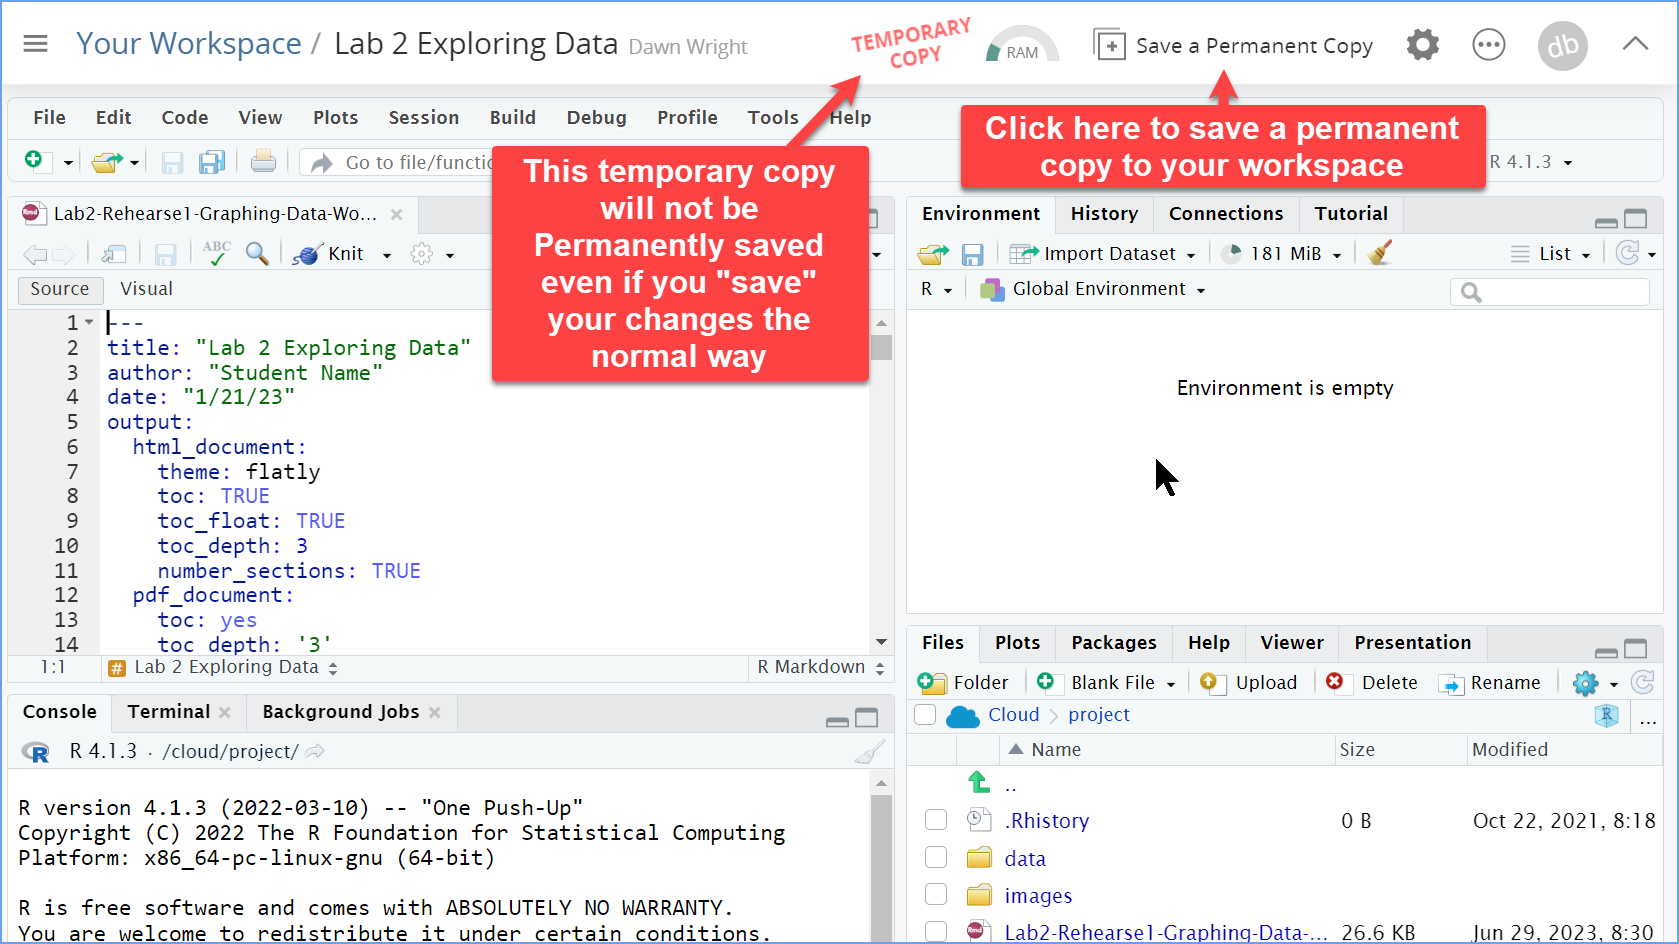
After it has deployed in your Posit Cloud workspace, remember to save the temporary project to your workspace.

R Markdown
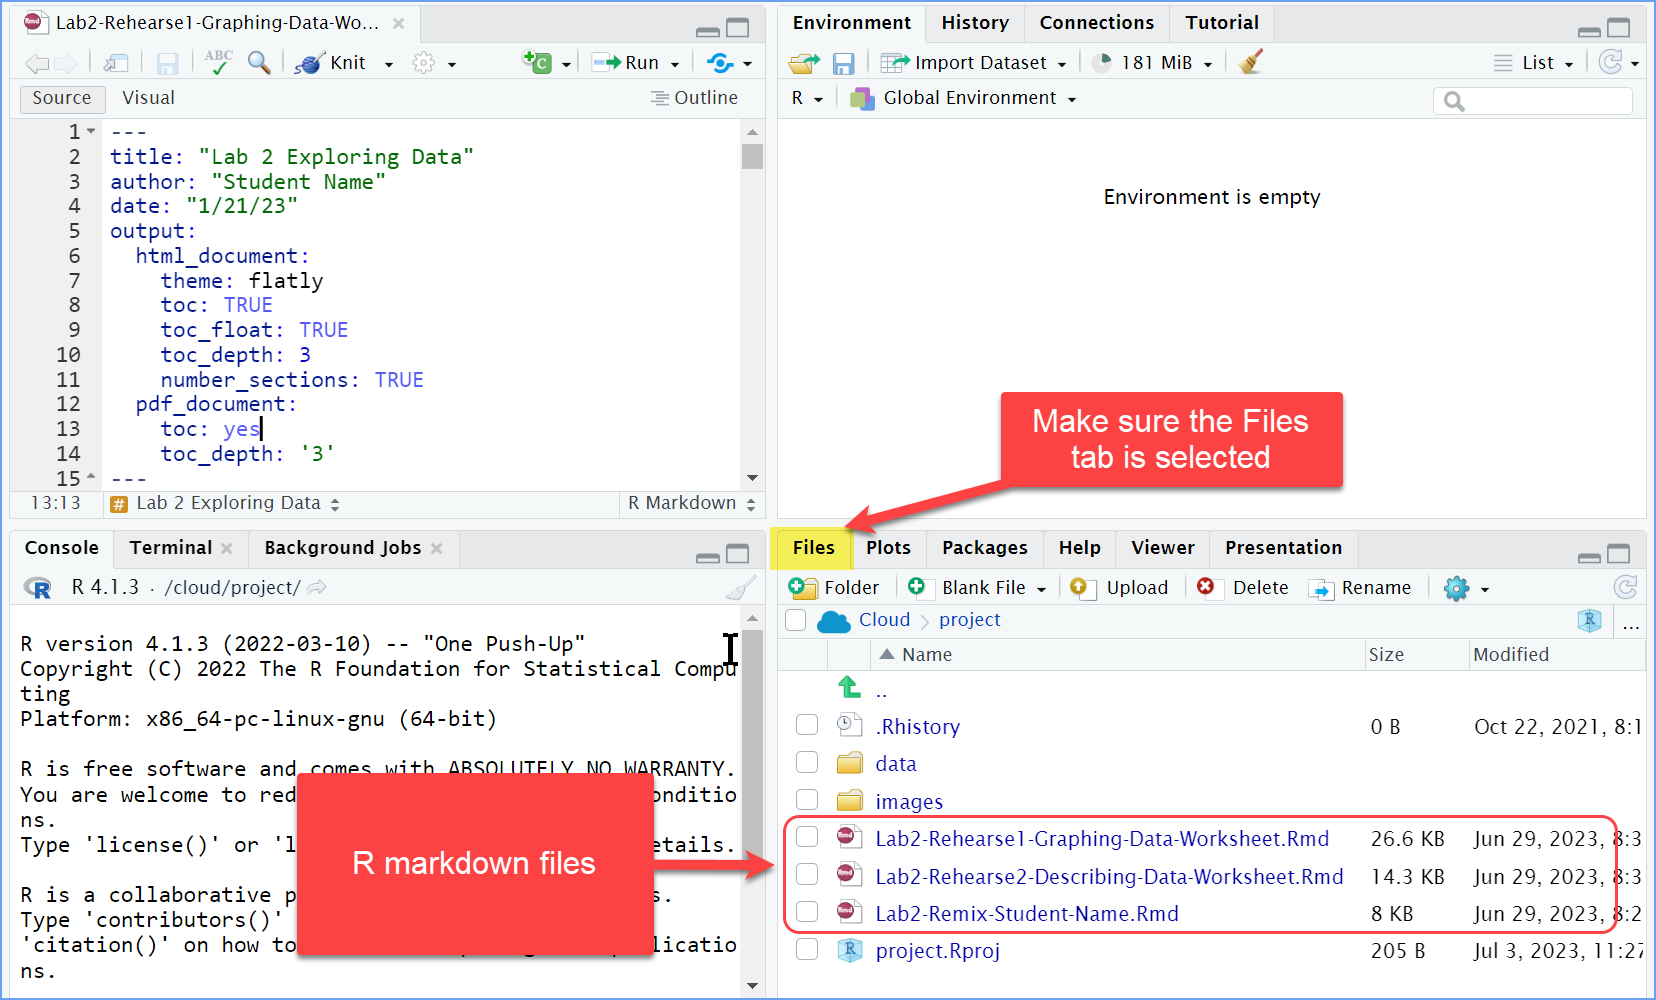
When you open the project in your workspace, you should see three R markdown (.Rmd) files. We use R Markdown in our labs in order to make it easier to create reproducible work.
Not required, but if you want to learn more about the capabilites/ How to of R markdown, check this out: 40 Reports with R Markdown.

There is a worksheet for Lab2-Rehearse1-Graphing-Data and another worksheet for Lab2-Rehearse2-Describing-Data. And a template, Lab2-Remix-Student-Name to be used for your Remix and Report where you apply a bit of what you learned and answer some questions.
When you work through each Rehearse/Remix session, you will use the appropriate R markdown (.Rmd) worksheet to capture your progress as you follow the instructions in the Rehearse/Remix web pages. You can keep the Rehearse/Remix page open on one browser tab and the appropriate worksheet in your Posit Cloud in another window/tab.
You will knit each document as you finish it (to Word or PDF) and submit all three in your Module 2 Assignment areas in Canvas. The two rehearse files should be submitted in M2.4 Lab 2 Rehearse(s): Exploring Data. The remix file should be submitted in M2.6 Lab 2 Remix and Report: Exploring Data.
Let’s get started with Lab 2!
Next: Lab 2 Rehearse 1 Graphing
Data

This
work was created by Dawn E. Wright and is licensed under a
Creative
Commons Attribution-ShareAlike 4.0 International License.
V2.0 10/29/25
Last Compiled 2025-10-29