Lab 5 Remix
Inference and Confidence Intervals
Remix & Report
Link to Posit Cloud
- Log into your Posit Cloud account.
- Open the Lab 5 Inference and Confidence Intervals project.
- Open the Lab-5-Remix-Student-Name.Rmd.

IMPORTANT!
Requirements
Remember to rename this file to include your name in place of “Student-Name”. For example, if your name is Susan Jones, your file name should be: Lab-05-Remix-Susan-Jones.Rmd.
Other than entering your name to replace “Student Name” in the “author” line at the top of this page, and changing the date to the current date, do not change anything in the head space.
Use of Generative AI Tools
![]()
Use of generative AI tools for this assignment is limited to your getting help debugging (fixing errors) or explaining code.
You may not use Gen AI to create entire code blocks/chunks.
You may not use Gen AI to generate conclusions based on analysis of a dataset.
You may not use Gen AI to write your answer to reflection questions which are usually indicated by this icon:
 .
.
Cite your use of AI using this APA guidance: https://apastyle.apa.org/blog/cite-generative-ai-references
Watch Walk Through Videos
Check in the Resources page for videos on this lab: Resources
The assignment
Load Packages
Copy the code from Lab 5 Rehearse 2 CC3 to load the required packages.
 Remix CC1
#Code hereLoad Data
For this Remix, you will work with data from the Rural Health Information Hub for the state of Alabama.
The code in Lab 5 Rehearse 2 CC4 will read in a .csv file from the /data folder and create a new data frame. Copy/paste it in the empty code block below.
You will need to edit it for the name of the data file: `Rural_Health_Data.csv`, which is in your /data folder.
Also edit the code to change the name of the data frame created to
rural_health.
Remix CC2
#Code hereYou should see the rural_health data object in the
Environment.
Inspect the Data
Left-click on the rural_health name in the Environment
to open the data object in the Source/Editor window.

Describe each of the six variables in the data set. Include the type (numerical or categorical).
If categorical, state the names of the levels.
Your answer here:
Research Question
Pick one of the following questions to answer:
Q1: Is there a difference in the mean obesity rate between “metro” and “nonmetro” counties in Alabama?
Q2: Is there a correlation between a county’s obesity rate and its leisure inactivity percentage?
To answer the question you choose, you will conduct a test of hypothesis using the process used in Lab 5 Rehearse 2.
Pick the example in Rehearse 2 appropriate for the question you chose to answer and “copy/paste/edit” the code chunks from it in this document.nt
State your choice of research question
Your anwer here:
What type of test is required to answer this question?
Your answer here:
Exploratory Data Analysis
Visualize the Data
Generate a visualization of the data using code from the appropriate example from Lab 5 Rehearse 2.
Remix CC3
#Code here
What do you “see” in the data visualization? Explain what it could mean.
Your answer here:
State Null and Alternative Hypotheses
Your answer below:
Ho:
Ha:
Specify the level of significance alpha.
Your Answer here:
Explain what this significance level means.
Your answer here:
Test the hypothesis - Downey-Infer Method
Step 1: Calculate the Observed test Statistic
Remix CC4
# Paste code here
What does the observed test statistic indicate?
Your Answer Here:
Step 2: Generate the Null Distribution
Remix CC5
# Paste code here
Explain the Null Distribution for this analysis is, i.e. what it tells us relative to your choice of research question.
Your Answer here:
Step 3: Visualize the Null and the Delta
Remix CC6
# Paste code here
Where does the red observed delta line
fall?
Your Answer here:
Do you think it happens often in the Null world?
Your Answer here:
Explain why you think this.
Your Answer here:
Do you think you will get a significant difference, i.e. a small p-value? Why?
Your Answer here:
Step 4: Calculate the p-value
Remix CC7
# Paste code here
Explain what a p-value is.
Your Answer here
What do you think this particular p-value tells us?
Your Answer here:
Step 5: Decide if delta_obs is statistically significant
Compare the p-value with the significance level alpha you selected for this analysis.
Remix CC8
# Paste code here
Results and Conclusions
Provide a one paragraph statement of your conclusions about the research question based on your analysis.
Your answer here:
Confidence Interval
Find the 95% confidence interval around the test statistic.
Remix CC9
# Paste code here
Explain what a confidence interval is.
Your answer here:
Does this particular confidence interval include “0”?
Your Answer here:
What does this CI tell you about the significance of the hypothesis test, if anything?
Your Answer here:
State what this CI tells us about the range of possible values for the test statistic in this analysis?
Your Answer here:
Traditional Hypothesis Test
Remix CC10
# Paste code here
How do the results from the traditional hypothesis test compare to the Downey/Infer method results?
Your Answer here:
Explain the assumptions of the traditional method of the hypothesis test.
Your Answer here:
Lab Assignment Submission
As you did in previous labs, when you have edited the code chunks, you need to Knit it to see the updated graphs and tables in your final report.
When you Knit an Rmarkdown (.Rmd) file, all code chunks in it are automatically run. Also, all data objects in the Environment are ignored.
When you are ready to create your final lab report, save the Lab-05-Remix-Your-Name.Rmd worksheet file and then Knit it to make a Word or PDF file.
Important
Remember you should replace “Your-Name” in the file name and have your actual name in the file name, e.g. Lab-05-Remix-John-Jones.Rmd.
You may have to “rename” your knitted file if you did not change the name of the .Rmd file before you knit it.
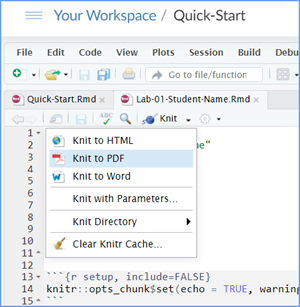
This image shows you how to change from “Knit to HTML” to “Knit to PDF” or “Knit to Word”.
Note that if you have difficulty getting the documents to Knit to Word or PDF and you cannot fix it, just save the completed worksheet and submit your Lab-05-Remix-John-Jones.Rmd file for partial credit.
Submit your file in the Canvas M5.4 Lab 5 Rehearse(s): Estimation and Confidence Intervals assignment area.
The Lab 5 Inference: Estimation and Confidence Intervals Grading Rubric will be used.

Congrats
You have completed Lab 5!
 Previous: Lab 5 Rehearse 2
This
work was created by Dawn Wright and is licensed under a
Creative
Commons Attribution-ShareAlike 4.0 International License.
V2.4, date 12/1/25
Last Compiled 2025-12-01