Lab 1: Remix & Report
Note: these are background chunks that are needed for knitting.
library(tidyverse)
library(lubridate)
library(scales)
library(DT)
library(unvotes)
unvotes <- un_votes %>%
inner_join(un_roll_calls, by = "rcid") %>%
inner_join(un_roll_call_issues, by = "rcid")
Photo by Ivan Bertolazzi from Pexels
Lab 1-Remix and Report
This first lab has a slightly different organization than you will see in the remaining labs.
The last two sections build off of the Quick-Start work you just completed. Here are the steps to follow:
Open your Posit Cloud account and navigate to the Lab 1 Quick-Start project workspace. Use this link: Posit Cloud
In your project Files, you should see a second RMarkdown ( .Rmd ) file named Lab-01-Remix-Student-Name.Rmd. This is your Remix & Report worksheet.
Check the box beside the file’s name and select Rename. Carefully, edit the file name and replace “Student-Name” with your first name and last name separated by hyphens. For example, my lab file would be Lab-01-Remix-Dawn-Wright.Rmd.
After you rename your worksheet file, click on that .Rmd file name to open it in the Source/Editor window.
Replace “author” with your name, and put in the current date in place of the old date.
 Caution!
Be careful to not change any thing else in the top of the document, which is called the “yaml”. All of your work will be after the notice in the document.
Remix
Follow the instructions in the Remix section of the template to edit the code chunks.
Use two different countries to replace China and Russia in the code chunk below.
See the Appendix below for the spelling of the country names in the data set.
 Hint! There are two
places in the code chunk where you will have to change the country
names.
Hint! There are two
places in the code chunk where you will have to change the country
names.
unvotes %>%
  filter(country %in% c("Russia", "United States", "China")) %>%
  mutate(year = year(date)) %>%
  group_by(country, year, issue) %>%
  summarize(percent_yes = mean(vote == "yes")) %>%
  ggplot(mapping = aes(x = year, y = percent_yes, color = country)) +
  geom_point(alpha = 0.4) +
  scale_color_manual(values = c("Russia" = "#1B9E77", "United States" = "#D95F02", "China" = "#7570B3")) +
  geom_smooth(method = "loess", se = FALSE) +
  facet_wrap(~issue) +
  scale_y_continuous(labels = percent) +
  labs(
    title = "Percentage of 'Yes' votes in the UN General Assembly",
    subtitle = "1946 to 2019",
    y = "% Yes",
    x = "Year",
    color = "Country"
  )+
theme_light()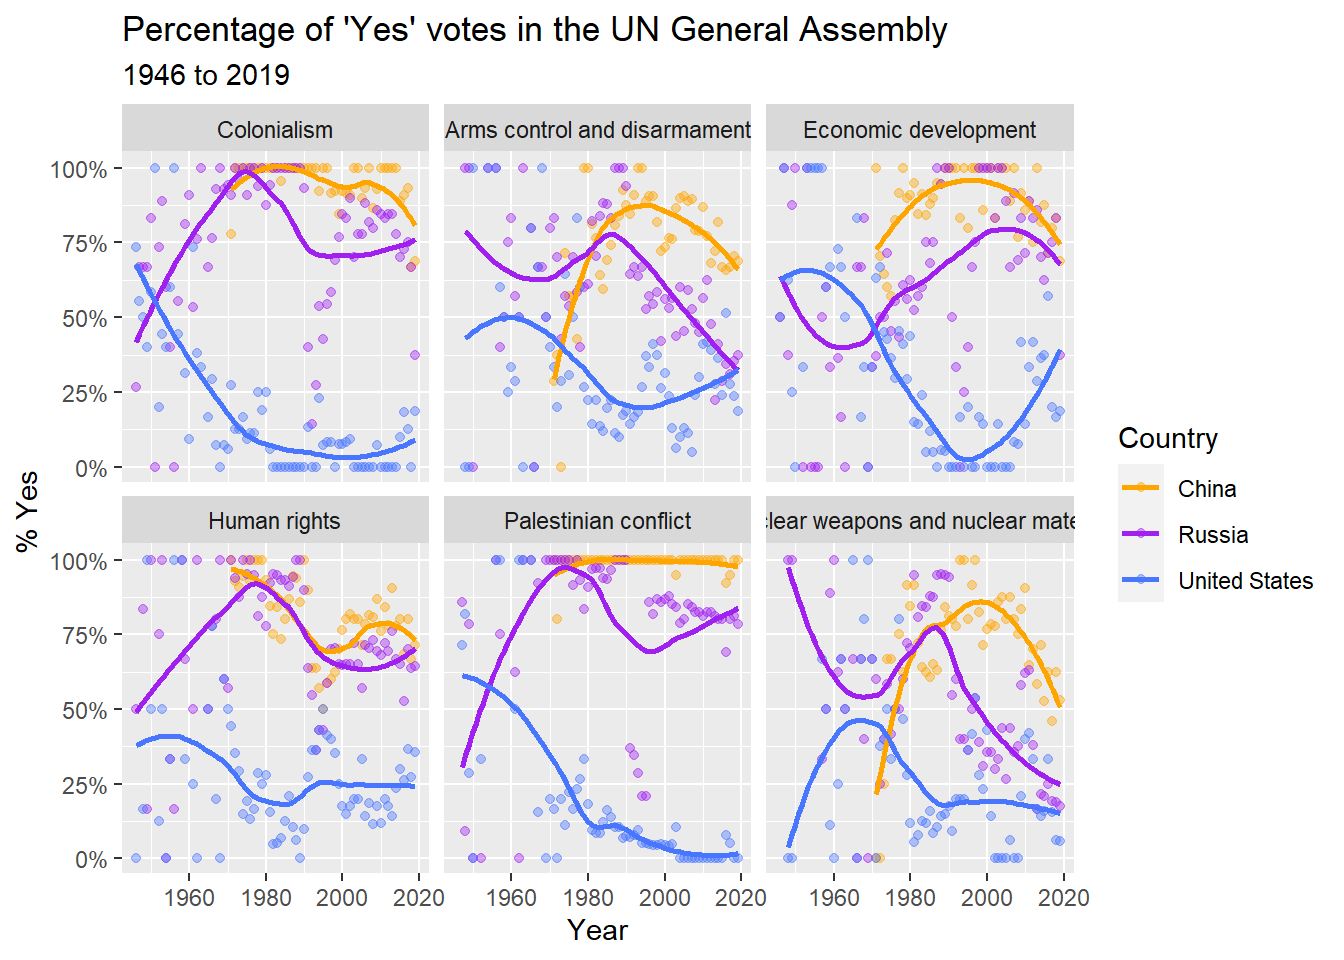
Run the edited code chunk to generate the new graph.
Report
In the Report section of the template, answer these questions about what you have learned so far in Module 1:
Question 1:
Many people believe data literacy is simply “being good at math/statistics.” Based on the four-part data literacy framework by D’Ignazio and Bhargava presented in the Module 1 Learning Pathway, why is that an incomplete description of what it means to be data literate?
Your answer here:
Question 2:
In the unvotes dataset, there are several kinds of
variables. One way to classify them is by their Measurement
Scale.
For information on Scales of Measurement, see your textbook Answering with Questions Section 1.8 Scales of Measurement
Q2a:
What measurement scale is the variable “country” in the
unvotes dataset?
Your answer here:
Q2b:
What measurement scale is the variable “date” in the
unvotes dataset?
Your answer here:
Recall you can click on the unvotes data object in the
Environment to open it in the Source/Editor window to refresh your
memory on the types of variables.
Question 3:
What do you see when you inspect the new facet graphs with your
countries? How are they similar and different from the original
set?
Your answer here:
Question 4:
Can you draw some conclusions about the three countries you selected?
Why do you think they have similar or different voting trend
lines?
Your answer here:
Question 5:
Discuss how you might be able to use this data visualization
technique in your work or personal life?
Your answer here:
Question 6:
Q6a:
On a scale of 1 to 10, with 1 being “just starting” and 10 being “I’m cool with this,” where do you think you are on the continuum of data literacy?
Your answer here:
Q6b:
Why do you grade yourself this way?
Your answer here:
Lab Assignment Submission
When you are ready to create your final lab report, save the
Lab1-Remix-Student-Name.Rmd file.
Remember to rename this file to include your name in
place of Student-Name,
e.g. “Lab1-Remix-Wright-Dawn.Rmd”.
Then then Knit it to Word or PDF to make a reproducible
file. This image below shows you how to select the knit document file
type.
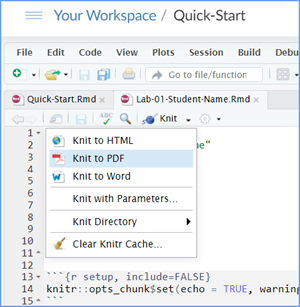

Note: knitting to a Word file is often easier (fewer snags/error messages) than knitting to a PDF file.
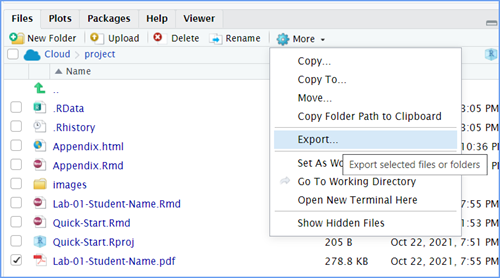
Finally, export the Lab-1-Remix-Your-Name Word or PDF document from Posit Cloud.
In the Files window, put a check mark by the files you want to export.
Go to More and click on the drop-down menu. Then select Export. The checked files will be downloaded to your computer.
Submit your Lab-01-Remix-Your-Name document file in your Canvas M1.6 Lab 1 Remix and Report: Quick Start Assignments area by Sunday Midnight ET.
Note: If you encounter difficulty getting your worksheet to knit to Word or PDF, reach out to your instructor via course email as soon as you can. Remember to include a shareable link to your Posit Cloud workspace: https://youtu.be/XMOSuNB_kBg
If you are against the submission deadline, you may submit your Lab 1-Remix-Your-Name.Rmd file saved with your work instead. Put a note with the shareable link in the Assignment Submission form about the problem you encountered.
The Lab 1 Quick Start Grading Rubric will be used.

 Previous: Lab 1 Rehearse 2 Debrief
Appendix
Below is a list of countries in the dataset:

This
work was created by Dawn Wright and is licensed under a
Creative
Commons Attribution-ShareAlike 4.0 International License.
Date V2.2: 1/14/26
Last Compiled 2026-01-14