Data Sets
In your workspace data folder
Texas Dept. of Public Safety
This is large sample (n = 500) of the 12,000 + employees in the Dept. of Public Safety. This is publicly available employee data and we have placed a copy in your M8 Data folder.
File name DPS_500.xlsx [download
file]
There are a number of variables but some are noteworthy in that they can act as explanatory variables:
- Sex - a binary label. Note Texas has not yet begun to code employees in other than the traditional binary.
- Race - “race” is a categorical variable with 6 levels
- Manager - a binary categorical variable Y or N meaning the person is classified as a manager or director and not a regular employee
- Salary - a quantitative variable representing the annual salary
- Classification - the job title, a categorical variable with many levels
Possible Research Questions for Texas Employee data:
- Is there a difference in the proportion of people who are managers in Dept of Public Safety who are classified female and the proportion of non-managers who are female?
- Is there a difference in the proportions by race of employees who are Troopers compared to the proportions by race of the Texas population?
- Is there a significant difference in the average salary for the six racial categories listed in the data set?
- There are other possible questions as well.
URLs
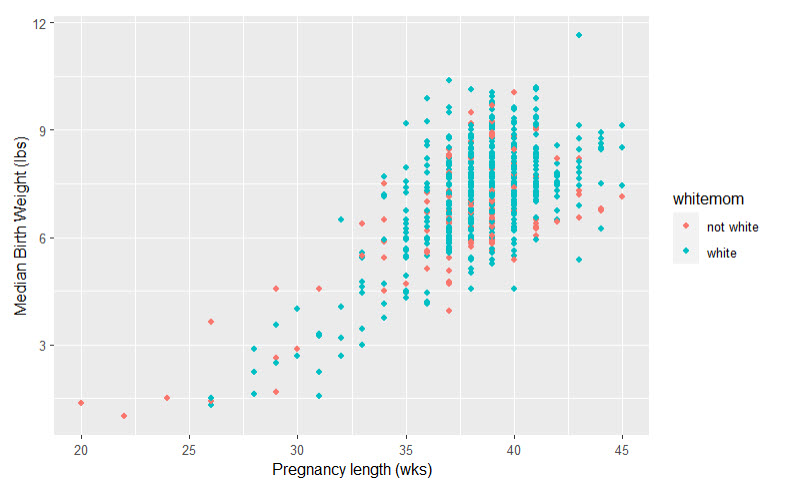
North Carolina Births
nc data set
- Source: Modern Dive “https://docs.google.com/spreadsheets/d/e/2PACX-1vTm2WZwNBoQdZhMgot7urbtu8eG7tzAq-60ZJsQ_nupykCAcW0OXebVpHksPWyR4x8xJTVQ8KAulAFS/pub?gid=202410847&single=true&output=csv”
- Alternate source: data folder as
nc_births.csv - 800 observations of 13 variables
- categorical examples: gender, smoking status, marital status, mom’s race
- and quantitative examples: term length, weight gain, birth weight
Simpson’s Paradox: Covid
A dataset on Delta Variant Covid-19 cases in the UK. This dataset gives a great example of Simpson’s Paradox. When aggregating results without regard to age group, the death rate for vaccinated individuals is higher – but they have a much higher risk population. Once we look at populations with more comparable risks (breakout age groups), we see that the vaccinated group tends to be lower risk in each risk-bucketed group and that many of the higher risk patients had gotten vaccinated.
 Note: this is an interesting
dataset, but using it for your PDP will be challenging.
Note: this is an interesting
dataset, but using it for your PDP will be challenging.
Challenge Replicate this analysis using R chunks.
- https://www.openintro.org/data/index.php?data=simpsons_paradox_covid
simpsons_paradox_covid.csv- 286,166 rows with 3 variables: age_group, vaccine_status, outcome
- Download csv file
- Background article https://www.covid-datascience.com/post/simpson-s-paradox-strikes-again-refuting-reports-vaxxed-have-5x-case-fatality-rate-than-untaxed
In packages
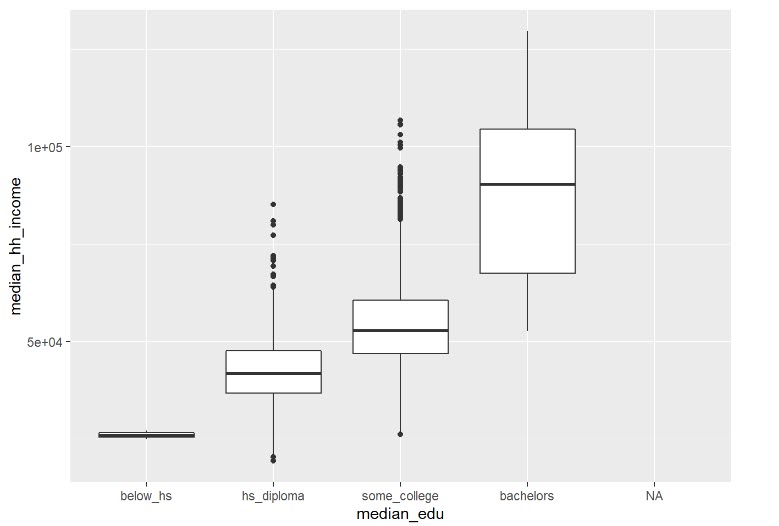
US Counties
- https://openintrostat.github.io/usdata/reference/county.html
- included in the
usdatapackage countyis a data frame with 3142 observations (the counties) with 14 categorical and quantitative variables.county_completehas all 188 variables [https://openintrostat.github.io/usdata/reference/county_complete.html]- The variables in
countyandcounty_complateare primarily quantitative and demographic and cover topics such as race, education level, income, uninsured rates, rate of computer use, smart phone use., broadband - See Code Chunks for how to load data from packages
Spam email
- http://openintrostat.github.io/openintro/reference/email.html
- included in
openintropackage emaildata frame 3921 observations on 21 variables;email_senthas 1252 observations of the same 21 variables- variables include many known spam words - number of times they appear in an email; whether or not the email was determined to be spam;
- See Code Chunks for how to load data from packages
Loan data from Lending Club
- http://openintrostat.github.io/openintro/reference/loans_full_schema.html#source
- included in
openintropackage loans_full_schema- full data set with 10,000 observations for 55 variables including categorical and quantitative.- categorical variables such as
homeownership,application_type,loan_purpose.state,emp_title - quantitative variables such as
loan_amount,interest_rate,balance,total_credit_limit,annual_income
- categorical variables such as
loan50data set -This is a sample for the larger loan data set from Lending club above- 50 observations of 18 variables including categorical and quantitative.
- See Code Chunks for how to load data from packages
Stents and Risk of Stroke
An experiment is designed to study the effectiveness of stents in treating patients at risk of stroke (Chimowitz et al. 2011). Stents are small mesh tubes that are placed inside narrow or weak arteries to assist in patient recovery after cardiac events and reduce the risk of an additional heart attack or death. Many doctors have hoped that there would be similar benefits for patients at risk of stroke. We start by writing the principal question the researchers hope to answer: Does the use of stents reduce the risk of stroke?
The researchers who asked this question conducted an experiment with 451 at-risk patients. Each volunteer patient was randomly assigned to one of two groups:
- Treatment group. Patients in the treatment group received a stent and medical management. The medical management included medications, management of risk factors, and help in lifestyle modification.
- Control group. Patients in the control group received the same medical management as the treatment group, but they did not receive stents.
stent30andstent265are found in theopenintropackage • http://openintrostat.github.io/openintro/reference/stent30.html •stent30results after 30 days from stroke •stent360results after 360 days from stroke • A data frame with 451 observations on the following 2 variables.- Group-a factor with levels control and treatment
- Outcome-a factor with levels no event and stroke
- See Code Chunks for how to load data from packages
OpenIntro Datasets
This is a list of the data set names with links to more info and to download the data set as a .csv data format.
Information is Beautiful
dedicated to making sense of the world with graphics & data-visuals.
Blog: examples of graphics & data visualizations
Beautiful news daily
US Census
Rural Health Information Hub
Select from a wide range of data on health disparities, health workforce, demographics, and more. Explore how metropolitan and nonmetro counties compare, nationwide and by state.
- Rural Data Explorer https://www.ruralhealthinfo.org/data-explorer
- How to use the Data Explorer https://www.ruralhealthinfo.org/visualizations/help
Others
- T.J. DeGroat has compiled a lovely repository of free data sets on health, economics, and more. https://www.springboard.com/blog/data-science/free-public-data-sets-data-science-project/
- IPEDS is the US Government’s repository of data on colleges. It will include information on admissions, enrollment, graduation rates, and more! https://nces.ed.gov/ipeds/
- Kaggle: A variety of free datasets are available on this website! Search the data bank for one that interests you. This source has a lot of sports and pop-culture data. https://www.kaggle.com/datasets
V2.2 Date: 12/17/25 Last Compiled 2025-12-17

This
work was created by Dawn Wright and is licensed under a
Creative
Commons Attribution-ShareAlike 4.0 International License.